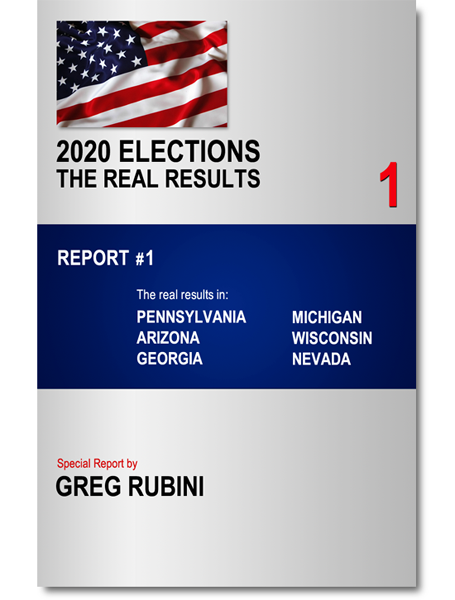
Election Report #1

The Real Results of the 2020 Elections in Pennsylvania, Arizona, Georgia, Michigan, Wisconsin, Nevada - Election Report #1


The Real Results of the 2020 Elections in:
– Pennsylvania, Arizona, Georgia
– Michigan, Wisconsin, Nevada

Data, charts, analysis

Election Report #1
by Greg Rubini
File format: PDF
89 pages
$12.00

Add to cart


Description

Greg Rubini published a series of 8 Election Reports, which reveal the Real Results of the 2020 Elections.
The Real Results have been found by “Reverse Engineering” the Election Fraud, using the scientific method.

There has been a Fraud of 45 Million votes in the 2020 Elections.
President Trump won by a Landslide.

In Election Report #1 you find the Real Results in:

– Pennsylvania
– Arizona
– Georgia

– Michigan
– Wisconsin
– Nevada

Election Report #1 has extensive data, charts and analysis:

This is the chart of Michigan:
Votes for Trump in Red
Votes for Biden in Blue

The Real Results of the 2020 Elections: the chart of Michigan - Election Report #1

In this chart you can see the injections of hundreds of thousands fake Biden votes, and the sudden spike in the middle of the night between November 3 and November 4.

The charts of Wisconsin and Georgia, that you find in the Report, are very similar to the Michigan chart.
Exactly the same pattern, the same modus operandi by the perpetrators of the Election Fraud.

The chart of Pennsylvania:

The Real Results of the 2020 Elections: the chart of Pennsylvania - Election Report #1

In this chart you can see the injections of hundreds of thousands fake Biden votes.
On the right half of the charts of Michigan and Pennsylvania you can see the constant injections of fake Biden votes done with mathematical precision to obtain a “Biden victory”.
Such mathematical precision can be achieved only by injecting rigging algorithms in the voting machines and tabulators. The right half of the charts have all the hallmarks of electronic manipulation.

The Fraud was highly sophisticated, it was multifaceted and multidimensional.
In Election Report #5 we dive in depth in “How They Did It”.

It was not just Michigan, Wisconsin, Georgia, Pennsylvania:
in the evening of November 3, Trump had a large advantage over Biden, in many States.
These are the original data of November 3, 2020 (included in the Report):

The Real Results of the 2020 Elections: the data of Pennsylvania, Georgia, Michigan, Wisconsin - Election Report #1

Notice the large advantage that Trump had also in Virginia, and in Rhode Island.

Then, during the night between November 3 and November 4, the counting of the votes was stopped.
Hundreds of thousands of fake Biden ballots were brought to the counting centers, and illegally added to the tally.
Besides, Trump votes were electronically “switched” to Biden, by injecting rigging codes in the voting machines and tabulators.


This is how the massive Election Fraud transformed the results:
advantage for Trump in Red
margin for Biden in Blue

The Real Results of the 2020 Elections: the data of Virginia of November 4

Exactly the same pattern, in all these States:
Evening of November 3: large advantage for Trump.
November 4, the final results: the Trump advantage “disappears”, and Biden “wins”.

These are the Real Results of the 2020 Elections in Pennsylvania, obtained thanks to the “Reverse Engineering” process (page from the Report):

The Real Results of the 2020 Elections in Pennsylvania - Election Report #1

By comparing the numbers in this page, you can see how massive the Election Fraud was.
There has been a Fraud of 1,000,000 votes in Pennsylvania.

The Fraud of 1,000,000 votes transformed the Trump victory in Pennsylvania, with a large 14.8% advantage over Joe Biden, into a fake “Biden win”.
This is what is called “Stealing an Election”.
And Pennsylvania is just one of the many States where the Elections were rigged.

You will find much more in the 89 pages of the Election Report.
To purchase the Report, click “Add to Cart”:

Election Report #1
89 pages
File format: PDF
$12.00

Add to cart


Note: it took 5 months of hard work and $60,000 from my own pocket to analyze all the data from 17 States, find out the pattern of the Fraud in each State, run the Reverse Engineering process, decrypt the Real Results of the 2020 Elections in each of the 17 States and Nationwide, and write these Reports. It has been a highly demanding endeavor.


More Election Reports:


Election Report #2

The Real Results in:
– Minnesota
– Colorado
– New Mexico
– Virginia
– Illinois

File format: PDF
87 pages
$12.00

Add to cart


Read more about Election Report #2


Election Report #3

The Real Results in:
– California
– Washington State
– Oregon

Data, charts, analysis

File format: PDF
110 pages
$15.00

Add to cart


Read more about Election Report #3


Election Report #8

The Real Results in:
– New York State
– New Jersey
– Connecticut

Data, charts, analysis

File format: PDF
65 pages
$12.00

Add to cart


Read more about Election Report #8


Nationwide


Election Report #4

The Real Results Nationwide
The Real Electoral College map
Data, charts, analysis

Report #4 of 8
123 pages
$15.00

Add to cart


Read more about Election Report #4


How they did it


Election Report #5

It was a Coup.
How they did it?
The voting machines,
Mail-in ballots,
The Propaganda Machine,
The Traitors

Report #5 of 8
72 pages
$15.00

Add to cart


Election Report #6

The Reverse Engineering process: how the Real Results of the 2020 Elections have been decrypted.

Report #6 of 8
102 pages
$15.00

Add to cart


Election Report #7

Analysis of the Voting Machines:
Dominion, ES&S, Smartmatic

Report #7 of 8
85 pages
$15.00

Add to cart


Back to Top

Shopping Cart
Scroll to Top