Election Report #7 |
|
 |
|
|
Analysis of the Voting Machines:
Report #7 of 8 |
|
|
File format: PDF |
|
Description
The Dominion Voting Machines are used in 28 States, including:
 The Dominion voting machines are used in Cook County, Illinois.
Cook County means Chicago. 2.3 million votes. The Dominion voting machines are used also in Maricopa County, Arizona. Maricopa County means Phoenix. Maricopa County counts for 65% of all the votes of Arizona. New York State use the Dominion voting machines in 52 of its 62 Counties. The other 10 Counties use the ES&S voting machines, which are the same “thing” as Dominion.
California
The Dominion voting machines are used in 40 of the 58 Counties of California, including: San Francisco, San Mateo, Contra Costa and Alameda, means that the Dominion voting machines control the entire San Francisco Bay Area.
Santa Clara County means Silicon Valley.
It is called “Dominion” not by chance.
Who is the King of Canada, right now?
Coincidence? |
|
Dominion controls the entire State of California.
Los Angeles County is the largest county in California, and the largest county in the entire USA.
Surprisingly, Los Angeles doesn’t use the Dominion voting machines.
Smartmatic. 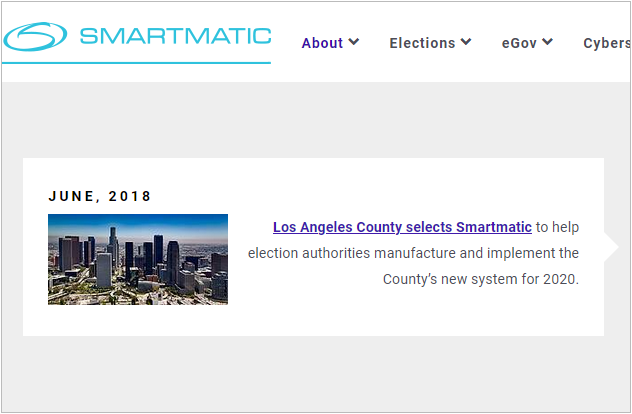
Do you want to know the names of the 3 guys from Venezuela who founded Smartmatic?
In 2014 a British guy took over Smartmatic.
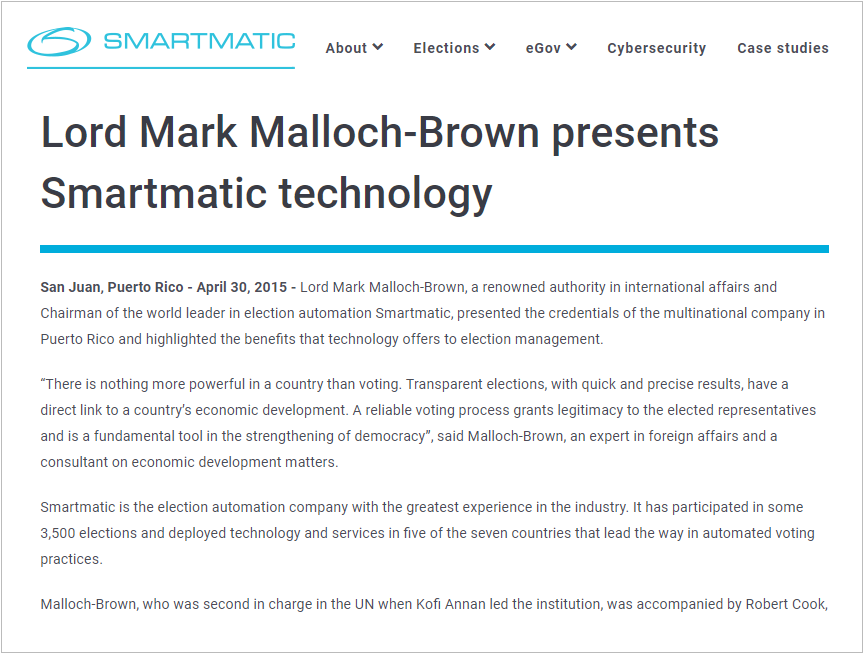
Mark Malloch Brown is a Big Gun in British politics:
Mark Malloch Brown is The Perfect Globalist.
And guess what?
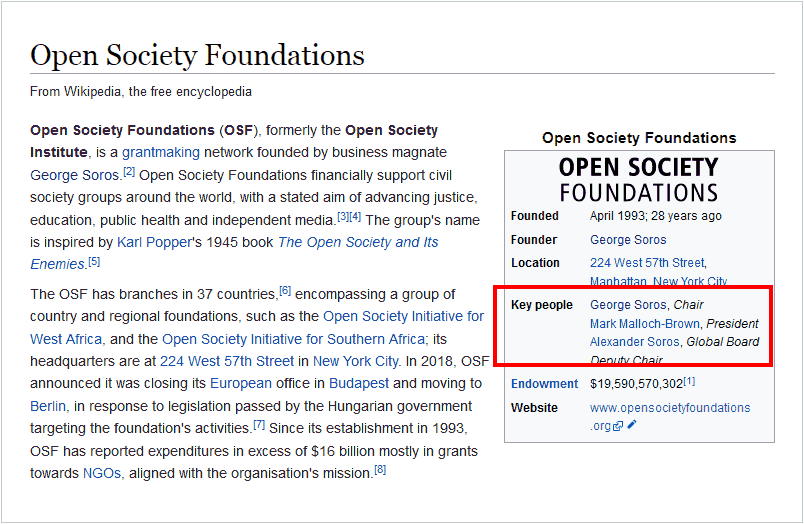
George Soros and Malloch Brown, together with Dominion, control 98% of all the votes of California.
No Control.
George Soros and Dominion control the outcome of the elections in California.
Elections
Dominion and Smartmatic (George Soros) control the outcome of the Elections in:
For a total of 232 Electoral College votes, considering just these States.
You will learn much more about the Voting Machines in Election Report #7:
Election Report #7
Analysis of the Voting Machines:
85 pages |
More Election Reports: |
||
 |
Election Report #1The Real Results in: File format: PDF
|
|
 |
Election Report #2The Real Results in: File format: PDF
|
 |
Election Report #3The Real Results in: Data, charts, analysis File format: PDF
|
 |
Election Report #8The Real Results in: Data, charts, analysis
File format: PDF
|
Nationwide |
||
 |
Election Report #4The Real Results Nationwide Report #4 of 8
|
|
How they did it |
||
 |
Election Report #5It was a Coup.
Report #5 of 8 |
|
 |
Election Report #6The Reverse Engineering process: how the Real Results of the 2020 Elections have been decrypted. Report #6 of 8 |
 |
Election Report #7Analysis of the Voting Machines:
Report #7 of 8 |

